Dashboard Overview
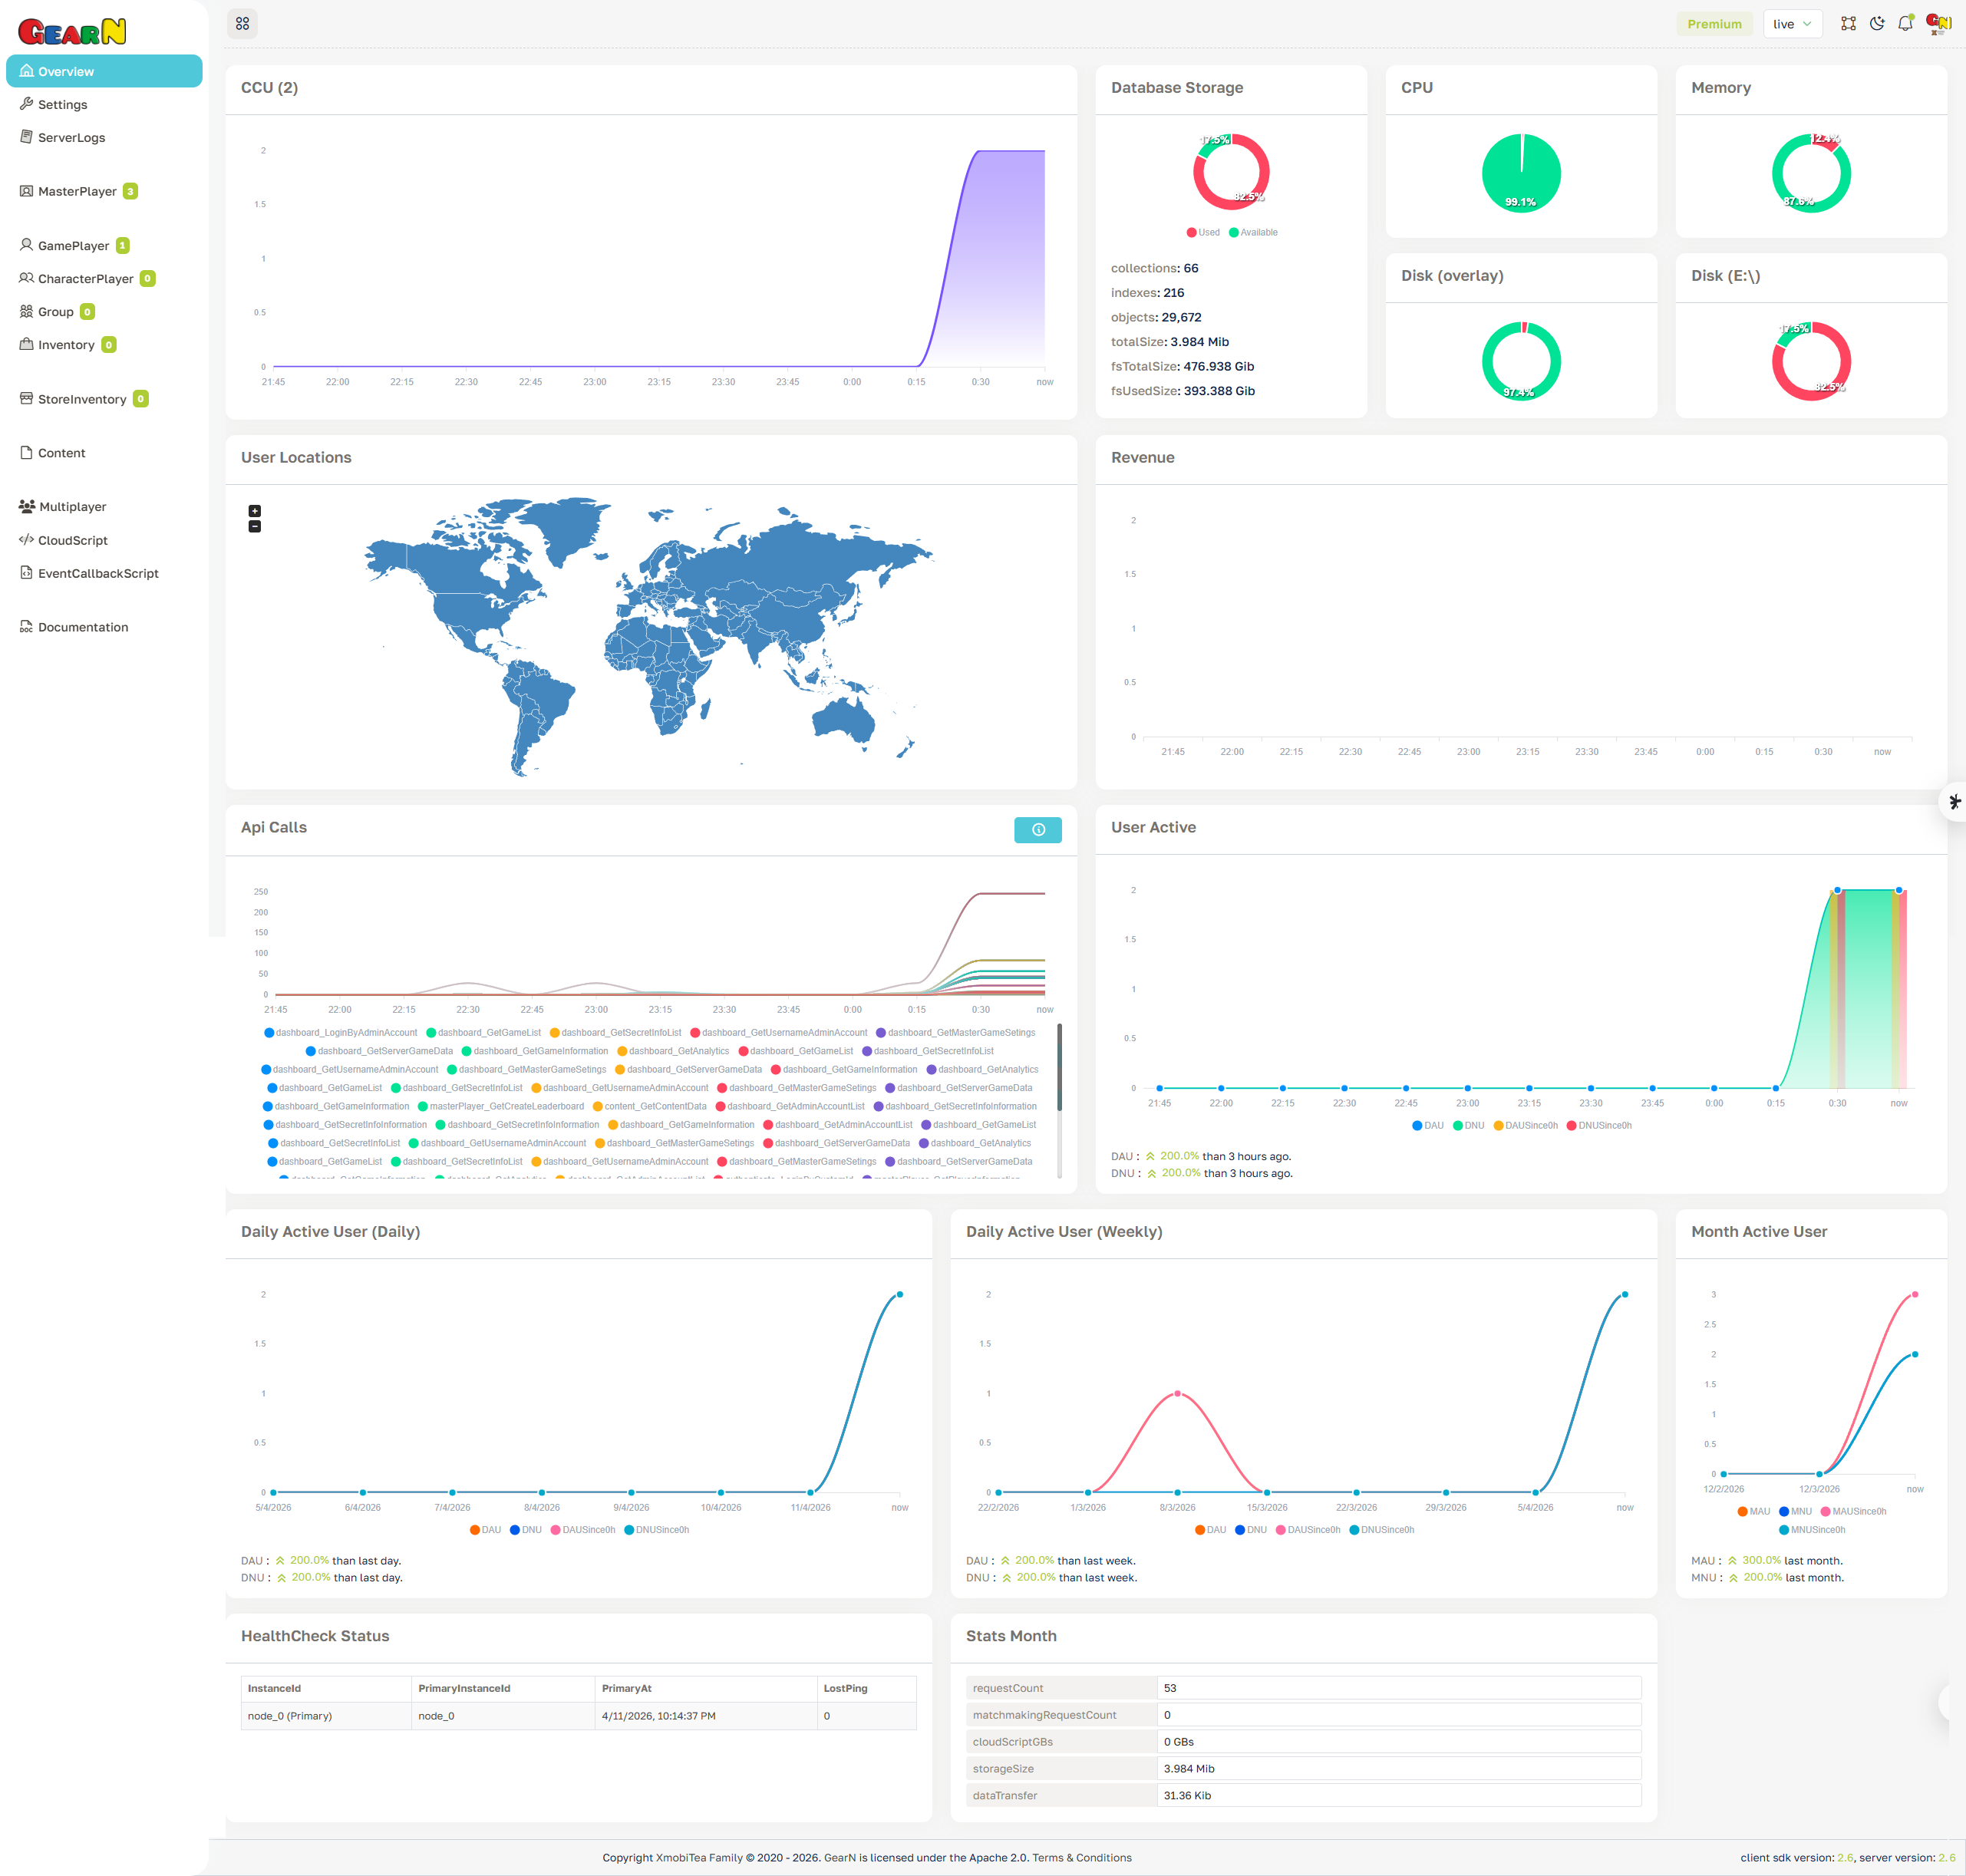
The Dashboard Overview is the first operational screen for checking GearN Server status. It summarizes realtime load, resource usage, user activity, storage, API calls, and health information before you drill into a specific module.
- Realtime load: CCU, API Calls, and Revenue help detect traffic spikes, drops, and request pressure.
- Infrastructure: Database Storage, CPU, Memory, and Disk widgets expose capacity and resource risk early.
- User activity: User Locations, User Active, DAU, DNU, MAU, and MNU show where players are active and how activity changes.
- Operation context: The sidebar counters, environment selector, HealthCheck Status, and monthly stats help verify live operations quickly.
Use this screen first when production behavior looks abnormal. If a chart or metric spikes here, open the related module to inspect the exact players, API calls, logs, or server resources.